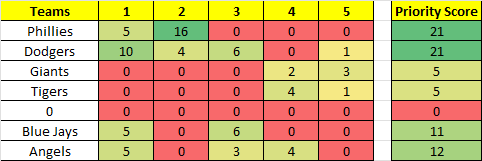
Welcome to the True AVG report! This will be a frequent post outlining the results of the True AVG models on the site which can be found in the MLB Range of Outcomes as well as the free Binomial Projections model and True AVG tables. The goal of these posts is to look into the numbers and find large outliers between production and regression. We can use that to take advantage of them in sports betting markets and daily fantasy sports.
Underlined phrases and words have links for extra information! All underlined players have a link to their Fangraphs page for ease of research!
What is MLB True AVG?
True AVG is a regressed metric based on batting average allowed for MLB starting pitchers. You can use it for finding pitchers that have had their results affected either positively or negatively by factors of luck. Basically, we are trying to take luck out of the equation and find what pitchers “truly” deserve. Similar to the predictive xHR/9 stat which I developed to leverage luck in home run deviations, True AVG has been built to be an intuitive way to assess realistic outcomes for pitchers. For more info, check out this video.
Model Results

Recap from the previous slate's post: Yesterday produced some great results from the models. the lowest True AVG went to Ohtani and he absolutely dominated, but he was no secret. A more nuanced outcome was for Jose Urquidy, who was underwhelming and was a pitcher to avoid based on the models. He gave up two runs with just three strikeouts in 6.2 innings.

Below you'll find a recap of the DFS and Betting models. These models are powered by True AVG and other powerful metrics! so, If you are enjoy the True AVG report, you should try out a subscription to the site for access (Find an option here!).


MLB True AVG notable results
Leading off the top of the models belongs to Blake Snell with the lowest overall True AVG. While a .333 BABIP isn't egregious in terms of league averages, it is a really high mark with pitchers who have low groundball rates like Snell. We should expect that to come down moving forward and let loose a phenomenal strikeout rate and ceiling. Sure, the walk rate sucks and is a big concern at nearly 6.00 per nine innings in the recent sample. However, a large chunk of that has come in just one game and his normal baseline is less putrid. Snell represents a highly volatile but enticing option in GPPs and should be a priority based on True AVG regression.
Next we move along to the highest True AVG going to Miles Mikolas. There's a lot of reasons to avoid Mikolas today before even considering his True AVG. He's got low strikeout rates and a middling xFIP on a team that struggles to earn wins. Likewise, his xFIP is really high and he just got rocked by the Reds. Today's matchup is with the Nationals, who are an equally bad opponent, with just a 90 wRC+ and league average strikeout and walk rates. Feel free to hit the unders on Mikolas and utilize the power bats for the Nationals in DFS.
Significant deviations to consider
- The largest positive deviations belong to our friend Patrick Sandoval who faces the Rangers. I believe this is the third straight start of writing about Sandoval in this portion of the column, so obviously we are due. It's hard to imagine a worse run for Sandoval in the recent sample. He has faced a top five team in the league in three of the last four and his ERA is at 7.11 while his xFIP is just 2.98. Likewise, his BABIP is nearly .500 over the same timeframe with a LOB rate below average. It's not often that everything points towards positive regression, but this is one of those spots. the Rangers are a league average team and represent a great “get right” spot for Sandoval. In sum, hit the overs in the strikeout markets and utilize Sandoval in DFS for some awesome leverage.
- The largest negative deviations are for Marcus Stroman up against the Giants. The year long sample is fine here, but the recent sample has been really lucky and won't continue. Stroman's BABIP, LOB rate, and home run rate numbers are all unsustainable and it's going to paint an ugly picture moving forward. Granted, the Giants are a weak opponent, with a 73 wRC+ and very little power, although their walk rate is one of the best in the league. You can stack the Giants in large field GPPs, but overall you'll just want to make sure you avoid Stroman.
